One of the hottest trading concepts on Twitter as of late has been what’s commonly referred to as DR/IDR, created by @IamMas7er. Its primary purpose is to give traders a certain degree of confidence that they are trading with the trend for that day.
The mechanics of the concept are actually very simple. You use the first hour of a trading session to establish a range. Then one price closes outside of that range, you have your “directional bias” confirmed, and you can be sure that the bottom of the range should only be revisited roughly 20%-25% of the time.
Again, the idea is, once one direction is confirmed, that is the “bias” for the day and the direction you want to trade.
In a screenshot posted by the creator himself, the success rates of the DR concept for the different trading sessions are as follows:
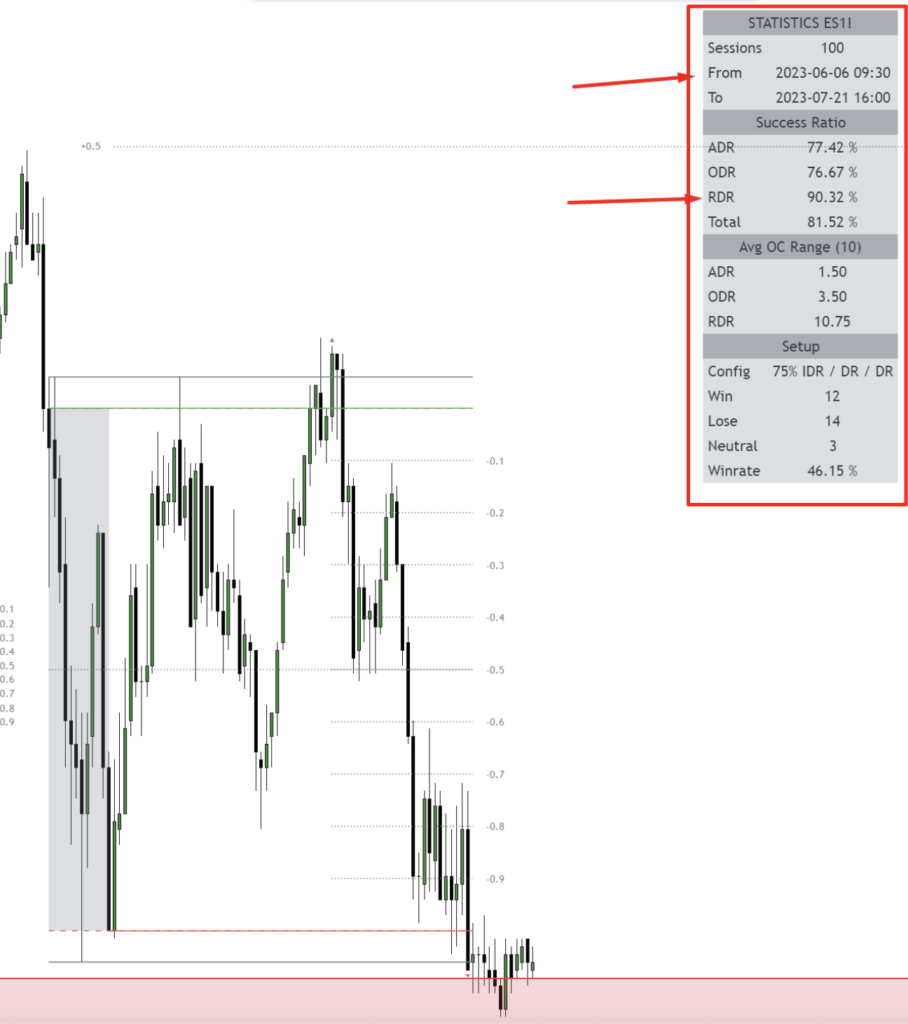
Something very important to keep in mind with these numbers are, a DR range is counted as a “success” if once the directional bias is confirmed by a breaking of the range, the other side of the range is not breached for the remainder of the session. The success rate IS NOT the probability of the price closing above the close price that confirms the range.
Because of this, DR/IDR is really more of a concept than a strategy.
As someone who enjoys exploring other people’s ideas of how they trade the market, it was only natural that I tried to cross-validate these probabilities using my own data and code.
Validating DR Numbers
Now before I jumped into coding my own implementation, intuitively, it made sense to me that the numbers would look like they do because of how price is structured in general.
Because price and time are very linked, you can basically be sure that, once one side of the range is busted, the probability of the other side getting breached, will be relatively small. And you can also be sure that the wider the initial range is, the lower the probability of breaching will be.
The smaller the range, the more the probability of breaching the other side of the range would increase. If the range was 0 pips, the probability of breaching it would 100% because the range is already breached at that point.
Now in terms of how @IamMas7er draws his ranges, he uses the open time of various sessions. This is a good way to do them as well because, there is often a boost of volatility at this time as the market “opens” in that region, which would produce sizable ranges created in the 1st hour of trading, than the kind of ranges that would occur in off hours or say towards the end of a session.
When I decided to look at the numbers for myself, I took a slightly different approach. I started with a very wide net, looking at the DR success rate for a range of any size created during any 1-hour period using 5-minute candles. I then started filtering the ranges so only ones that were at least x pips wide were considered valid opportunities.
Below is what this looked like on GBP/USD, using the 5 min chart letting the first 12 candles of a 96-candle period create the DR range.
- Min Rage Size: Any – DR Success Rate: 50.9%
- Min Rage Size: 10 Pips – DR Success Rate: 62.9%
- Min Rage Size: 20 – DR Success Rate: 72.3%
- Min Rage Size: 30 – DR Success Rate: 84.36%
- Min Rage Size: 40 – DR Success Rate: 93.1%
So as you can see, the larger the range, the higher the likely hood of the DR concept accurately predicting the probability that the other side of the range won’t be breached.
Is this because the range is magic? or drawing it on certain candles is magic?
Unfortunately no, it’s simply because that is how price works from a structural standpoint. Price is a function of time. The further you are looking for it to travel in the same amount of time, the less likely it is to reach that point.
If the starting range is only 10 pips, the probability of price moving 10 pips over the next 84 candles is much higher than if the range was 40 pips. This is simply because you are looking for the price to move 4 times further in the same amount of time, so of course the probability of that happening will be much smaller.
I am willing to bet if you calculated the average size of the range at the various sessions, the sizes will closely match the sizes I used to get similar success ratios.
In other words, the more volatile the period you use the create the range, the higher the probability is that price will not breach the other side of the range when one side is confirmed.
Additional Filtering
As we increased the range used to qualify a valid DR setup, we saw the accuracy increase over time. The next kind of filtering I think could be valuable to traders is the time left in the session when the range is confirmed.
Remember, price is a function of time, so if once a side is confirmed, there are only 12 candles left in the session, it’s very unlikely that that setup’s range is going to exceed the initial DR range, leaving little opportunity for profits once a direction is confirmed.
So on a fundamental level, you can assert, the quicker a direction is confirmed, the more time price has to move in that direction. The more time price has, the easier it will be for the price to go further than its initial range.
Additionally, the faster a side confirms, you can also assume the “trend” is stronger in that direction. If a side takes forever to confirm, that basically means the market is stuck ranging in the initial DR setup, undecided on where it wants to move.
Let’s look at some quick numbers:
Any Size DR Range:
- Min Rage Size: Any – minTimeLeft: 12 Candles – DR Success Rate: 54%
- Min Rage Size: Any – minTimeLeft: 24 Candles – DR Success Rate: 58%
- Min Rage Size: Any – minTimeLeft: 36 Candles – DR Success Rate: 64%
- Min Rage Size: Any – minTimeLeft: 48 Candles – DR Success Rate: 70%
Min DR Range of 20 pips:
- Min Rage Size: 20 pips – minTimeLeft: 12 Candles – DR Success Rate: 75%
- Min Rage Size: 20 pips – minTimeLeft: 24 Candles – DR Success Rate: 79%
- Min Rage Size: 20 pips – minTimeLeft: 36 Candles – DR Success Rate: 83%
- Min Rage Size: 20 pips – minTimeLeft: 48 Candles – DR Success Rate: 86%
Min DR Range of 40 pips:
- Min Rage Size: 40 pips – minTimeLeft: 12 Candles – DR Success Rate: 93%
- Min Rage Size: 40 pips – minTimeLeft: 24 Candles – DR Success Rate: 93%
- Min Rage Size: 40 pips – minTimeLeft: 36 Candles – DR Success Rate: 93%
- Min Rage Size: 40 pips – minTimeLeft: 48 Candles – DR Success Rate: 95%
One thing you should notice is, once the min range size is large enough to where the DR success rate is already 90%+, the minTimeLeft filtering doesn’t impact the success ratio. This is to be expected because the price is already a lot less likely to travel 40 pips than it is say 20 or 10 for any 84 or less candle period.
Conclusion
Overall, I really like the concept of the DR. The numbers check out on my end in regard to the range’s success rates over time.
However, as I mentioned at the start, this is really more of a concept for determining direction than a direct strategy and I think @IamMas7er would agree with that since he doesn’t trade just this concept directly, but seems to only use it to determine the direction he is going to trade.
Lastly, in this post, I am just looking at GBP/USD but since price is fractal in nature and the structure of price is the same across every asset, you can be sure the other currency pairs will function the same way. The ranges will just be different based on that pair’s volatility and current price (1% of 100 is larger than 1% of 50).