When it comes to trading and investing, everybody and their momma is well aware of who Goldman Sachs.
They are basically considered to be the place where the best traders in the world trade or have traded with in the past.
If you’re like me, you know about them but are probably wondering… “How good can they actually be?”
Thankfully since they are a publicly traded company, we can actually see how good they are, and the results will likely astonish you (I know they astonished me).
The 10-K Results
Since Goldman is publicly traded, they are legally required to report a 10-K each year. This is a massive report packed full of interesting information regarding how they operate across all of their different business verticles. It’s long and dense but definitely worth looking at.
You can find their 10-Ks here: https://www.goldmansachs.com/investor-relations/financials/10k/
Now, in every single one of these, around pages 95-115 or so, they will have a section talking about the performance of their trading desk.
The trading desk activity is broken down into 4 Categories:
- Interest Rates
- Equity Prices
- Currency Rates
- Commodity Prices
So these are the four high-level markets they are dealing in. Now in 95-115 page range, you will see a section that looks like this from GS’s 2022 10-K:
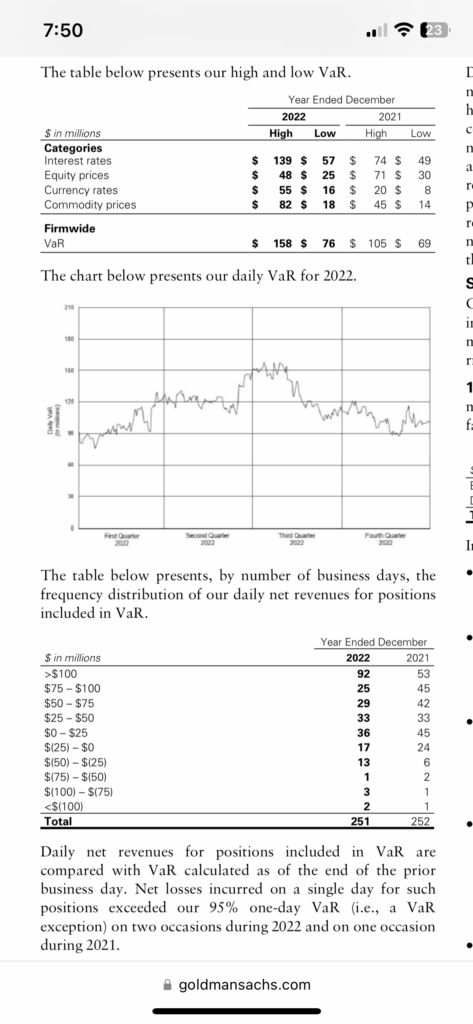
At the top, we have their VaR (Value At Risk) throughout the year, which measures how much risk they had taken on at any given point.
Then below is where the juice is. Under the graph of their VaR, we can see a table showing the distribution of their Daily Net Revenues from all of their positions.
What’s truly amazing about their performance is, they profit on any given day at a significantly higher rate than they lose. Additionally, the size of their profits are much larger on average than the size of their losses.
The table doesn’t do as much just as a graph so below is a histogram using the table above.

Now that the data is in graph format, we can clearly see how amazing this performance actually is.
In terms of managing risk, they only have a losing day, roughly 15% of the time, and on those days, their loss on average will be between 0 and -$50M.
On the flip side, they profit nearly 85% of the time and their average profit is $75M+
This kind of performance in the retail world would be absolutely insane. Typically traders who have an 85% win rate, will have a profit and loss distribution that consists of the losses typically being 3-4 the size of their wins.
Goldman on the other hand is essentially the reverse of that. Not only do they have an extremely high win rate of 85%, but their losses are also much smaller than their wins.
With these rough numbers, the expected value of their trading desk each day is $56.25M… Yes, based on their numbers, they can expect to make roughly $56.25 million dollars each day when the year is all said and done…
Don’t just take my word for it either…
Go look at their 10-Ks yourself. This distribution looks essentially the same, year after year after year…
Final Thoughts…
I hope you found this small look into Goldman Sachs as interesting as I did. Mainly because it shows you just how well traders can do in the market when they have proven edges and strategies. It should also highlight the fact that yes, markets are extremely efficient, BUT, they are not perfectly random.
It is possible to profitably trade them in a consistent way if you know what you are doing and Goldman’s 10-Ks are a stunning proof of this.