Have you ever asked yourself where the edges lie in trading? Some will say it’s in special indicators, and others will say it’s in being disciplined as a trader.
Although these sound promising, the reality is, the edges are in the distribution of price itself.
Let me explain.
Every asset you trade has a price distribution and they all look similar to the one below:
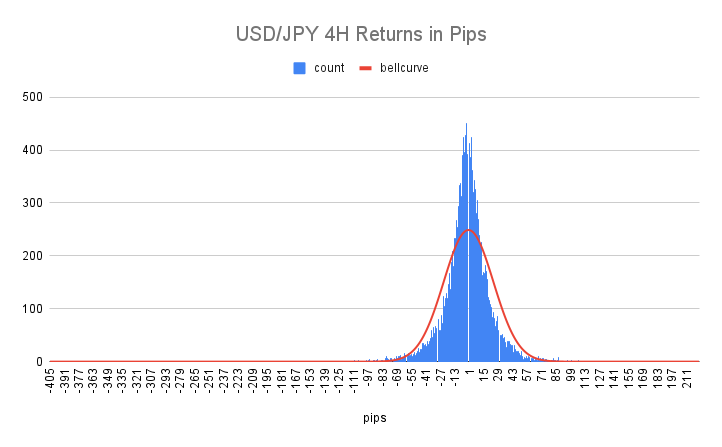
The blue bars show the 4H candle returns in pips, and the red line shows what the distribution should look like if it were perfectly normal or random.
It’s important to remember that, if prices were perfectly distributed in a normal distribution, you could not make any money from trading the underlying directly. You could see theoretically make money collecting swaps or credits from selling options, but in terms of making money by entering and exiting the market, all your trades would eventually wash out to 0.
This means that in order for there to be any kind of edge present, it must be in the distribution itself, specifically, in the parts where the distribution behaves differently than what you would expect if it were normal.
The visual above shows us there the price is definitely not random, so knowing this, we want to quantify it a bit more by looking at the descriptive statistics of the distribution.
In the distribution above, they are as follows:
- Mode: -2
- Median: -2
- Mean: -1.77
- Skew: -0.62
- Kurtosis: 14.73
The Mode, Median, and Mean
First let’s look at the Mode, Median, and Mean. In a normal distribution, these would all be 0. If you notice in this distribution they all basically center around -2 pips, which conveniently is the same size as the average spread from my data source (Oanda V20 API). So if there was no spread to pay when trading, these numbers would pretty much all be 0.
What this tells is, for the most part, this distribution is directionally normal, meaning there isn’t really an edge in predicting whether or not the price will trade up or down for any given period.
If the mode, median, and mean were significantly smaller or larger than 0, the distribution would clearly be directionally biased one way or the other. In this case, significantly larger would at a minimum be 5 times larger than the spread.
How To Build A System Around This Edge
If this type of edge was shown to be consistently present in a distribution, you would want to build a strategy around taking advantage of it.
With this kind of edge, there are 2 main trading styles that would work well and they are:
- Buy and Hold: This would mean that once you entered a position, you would not use a stop loss or take profit to get out of the position. You would either use some kind of time exit or some other signal.
- Fixed Stop Loss and Take Profit: Because the distribution is clearly directionally biased, the best kind of strategy to use on it would be one that uses a fixed stop loss and take profit. When it comes to risk:reward ratios, all of them will perform the same because the edge is in the direction, not the risk:reward ratio you choose to use.
Something important to note here is, although the Fixed Stop Loss and Take Profit strategy is the best to use if there is a directional bias, it is actually the worst kind of strategy you could use if there is not a clear directional bias in distribution.
If you try to use this kind of strategy under these conditions, you will never be able to turn a profit because the only way a fixed stop loss and take profit strategy can work, is if there is directional bias.
The Skew
This is also reinforced by the Skew reading being -0.62. What this tells us is the direction of outliers in the dataset. And in this reading, the largest outliers are skewed to the left.
But only slightly. Since the distribution is practically directionally normal, we also have outliers on the right side, they are just a little bit smaller than the left in this particular 5000-candle sample.
If you were to run multiple samples, the Mode, Median, and Mean would all be very stable, and the skew would oscillate around 0 depending on which side the largest outlier is.
The only way the distribution would not be directionally random would be if the skew was significantly larger, and the Mode and Median of the distribution were significantly above or below 0.
How To Build A System Around This Edge
Because the skew is really only valuable for determining a direction bias if you also factor in the Mode, Median, and Mean of the distribution, you would want to build your system in the same way described in Mode, Median and Mean section above.
The Kurtosis
The last reading is where it gets interesting. The kurtosis. In a normal distribution, this value would be 3. In the distribution above it’s an astonishing 14!
If the kurtosis is higher than 3, this tells us that the distribution is fat-tailed, meaning it has larger and more frequent outlier events than what would be observed in a normal distribution.
A deviation this large should be sending alarm bells off as this is clearly showing where the edge in price lies. What a value like this means is, the outliers of the distribution are significantly larger than what they should be, and they occur significantly more often than they should.
How To Build A System Around This Edge
If you were building a strategy to trade this kind of edge, you would want to structure it so that it benefits from outlier events. This would mean using the trading style below:
- Fixed Stop Loss And No Take Profit: In this kind of trading, you would want to use a relatively tight stop, and no take profit. You would either use some kind of time exit or some other signal.
It is important to understand this because this will allow you to capture the outlier events when they occur. The fact that there are more outlier events than expected and they are larger than expected, is where the actual edge is.
It’s also important to note that if this is the only kind of edge present in a distribution, you can not successfully use the trading styles below:
- Buy and Hold: This type of trading will not work because not only will you receive all of the outlier winning trades, but you will also receive all outlier losing trades and they will eventually cancel each other out.
- Fixed Stop Loss and Fixed Take Profit: This type of trading style will not work either because even though the distribution is fat-tailed, it still can have no directional edge at all.
- Fixed Take Profit and No Stop Loss: This kind of trading will never work with a distribution that has this edge because you will have large losses much more frequently than what would be expected. And since you cap your gains so you never receive any of the big outlier winning trades, your losses will always eat your small wins.
Conclusion
I hope this illustrates what I mean when I say, the edges are in the distribution itself. One last thing I want to mention before closing this out is, when you see these initial deviations on the entire price distribution, this does not mean that the distribution right out of the box can be used to consistently generate profits.
What it does mean though is you know how you need to structure your strategy so that it targets what kind of deviations you are observing. Adding entry and exit rules will change the distribution you are actually trading, so you want to create your rules so that they will take advantage of the initial deviations discovered in the original price distribution.
Remember, all of these values are estimates of the true values based on a small sample. Because prices are infinitely dynamic, there are no real true values. Because of this, it’s important to monitor these numbers after you have created your strategy, so you can adjust if and when market conditions change.
In our next post, we will be discussing how you need to structure your strategy depending on what deviations from normalness are observed in the distribution of the pair you are trading so stay tuned for that!